Why does a 15W wireless charger
often deliver only 8–11W to the battery?
Understanding where wireless charging efficiency is gained—or lost—and how engineers optimize every stage from adapter to battery.
Wireless charging efficiency is the ratio of energy stored in the battery to the energy drawn from the charger input. It is typically measured end-to-end, from the USB-C input connector to the battery terminal.
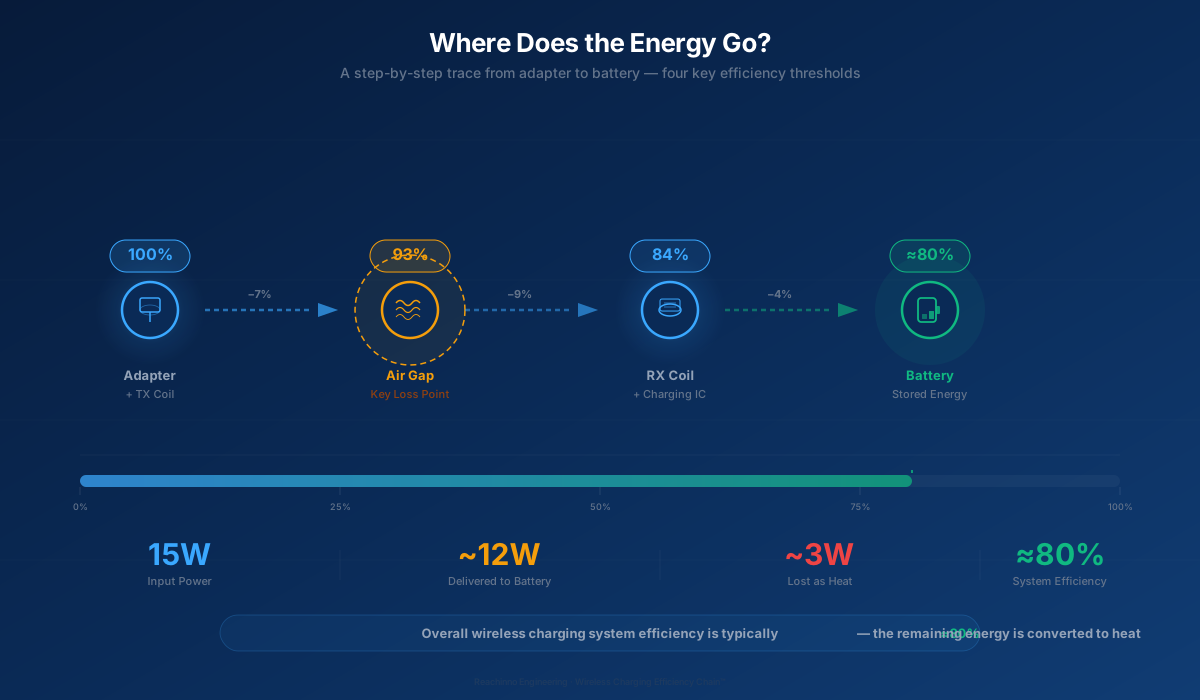
Engineering Insight: The air gap between TX and RX coils is typically the single largest variable. In many commercial designs, magnetic coupling coefficient k drops with the cube of distance — doubling the gap can reduce efficiency by 8–12%.
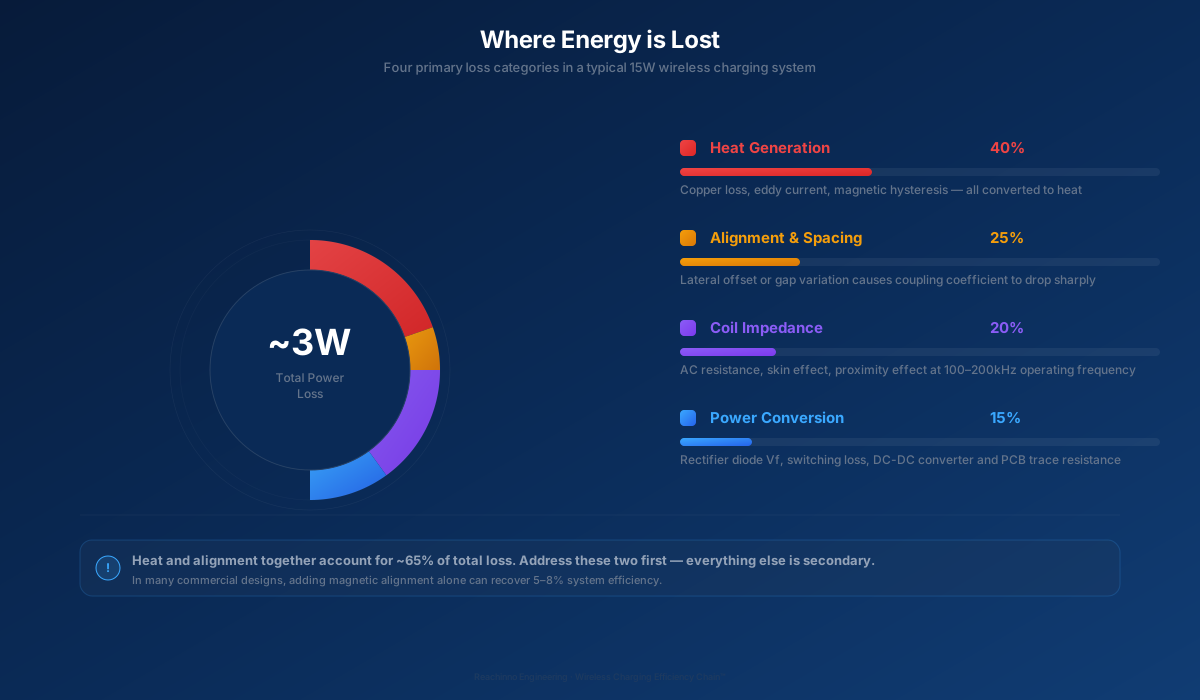
Engineering Insight: Heat and alignment together may account for ~65% of total loss. Addressing these two factors — through coil design and magnetic alignment — often delivers the highest return on engineering effort.
Reachinno RK-TX01 transmitter + RK-RX03 receiver, Qi EPP profile, 25°C ambient, 30-minute test duration.
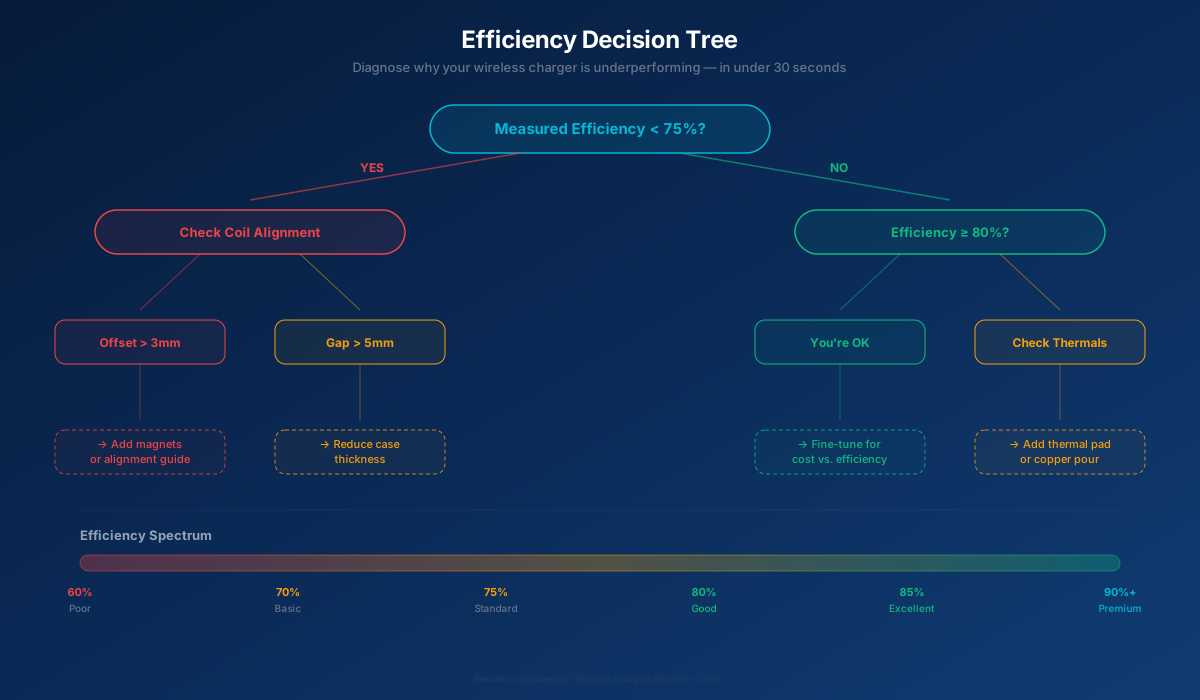
Engineering Insight: In many designs, a 3mm lateral offset can reduce efficiency from ~82% to ~75%. Adding magnetic alignment (Qi2-style) often recovers 5–8% of system efficiency with minimal BOM cost.
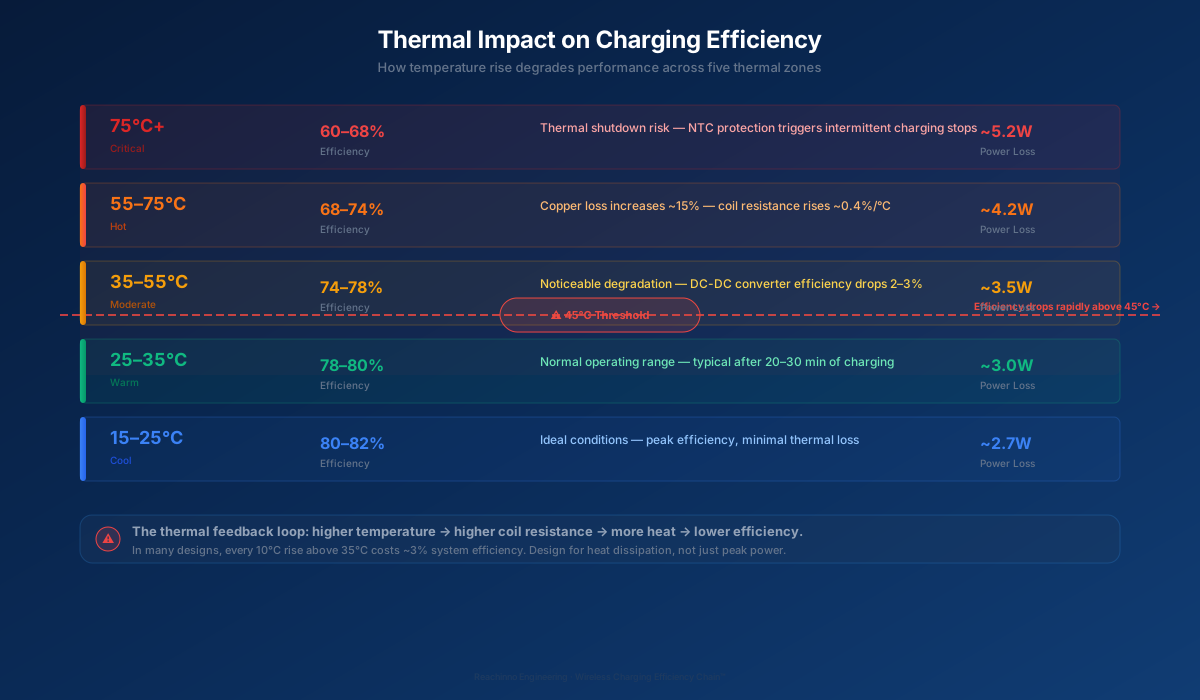
Engineering Insight: Three strategies dominate effective thermal management: spread heat with PCB copper pours, sink heat through thermal pads to the chassis, and manage heat via temperature-aware firmware power folding — gradually reducing TX power rather than abruptly shutting down.
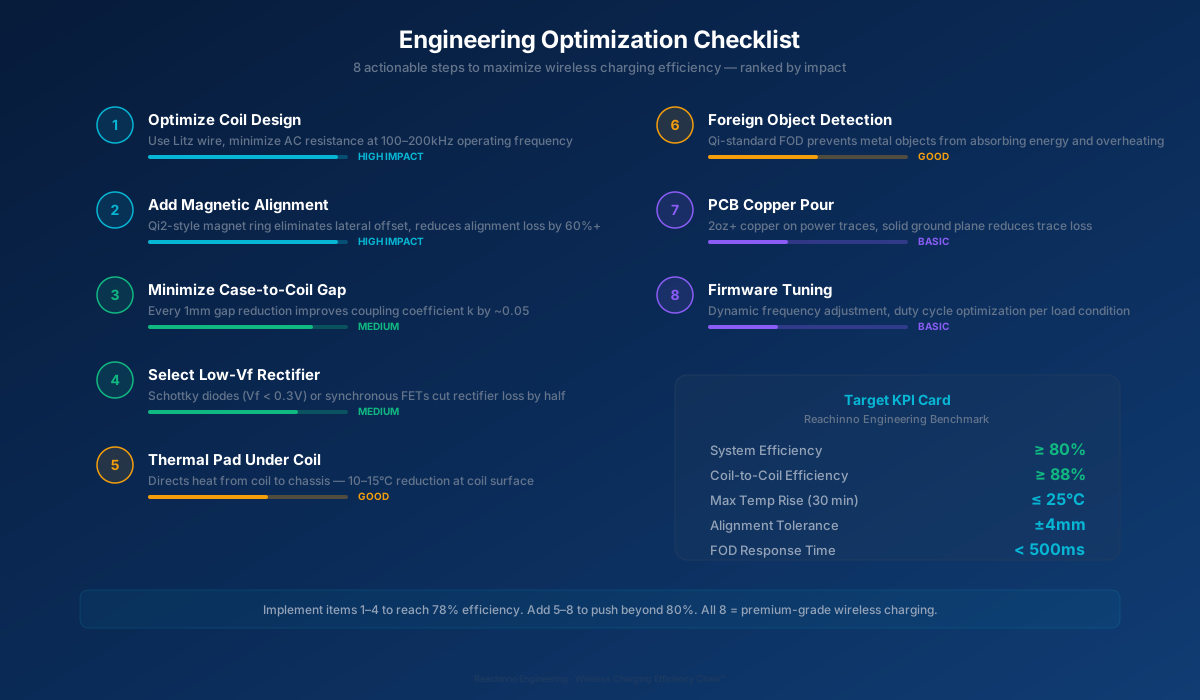
Engineering Insight: Coil design and magnetic alignment are typically the highest-impact optimizations. Litz wire construction and Qi2-compatible magnet rings often deliver measurable efficiency gains in the first design iteration.
From 65% to 82% — That’s the Reachinno Difference
Our engineering team has tested hundreds of coil configurations, thermal layouts, and firmware profiles. Whether you’re designing a Qi2 charger, a multi-device pad, or an automotive wireless dock, the Efficiency Chain™ framework gives you a systematic approach to maximizing performance.
Talk to Our Engineering Team →Complete test data, coil design guidelines, thermal simulation results. 12 pages.