Framework RK-01 · Industry & Strategy

Portable Power Industry Evolution Model

A five-stage decision framework to position your product strategy in the portable power industry lifecycle — before the market does it for you.

In One Minute

The portable power industry has evolved through five distinct competitive stages. The strategy that wins in Stage 2 fails in Stage 4 — not because it is bad, but because it was designed for a different industry structure. This framework gives you the stage-matching algorithm.

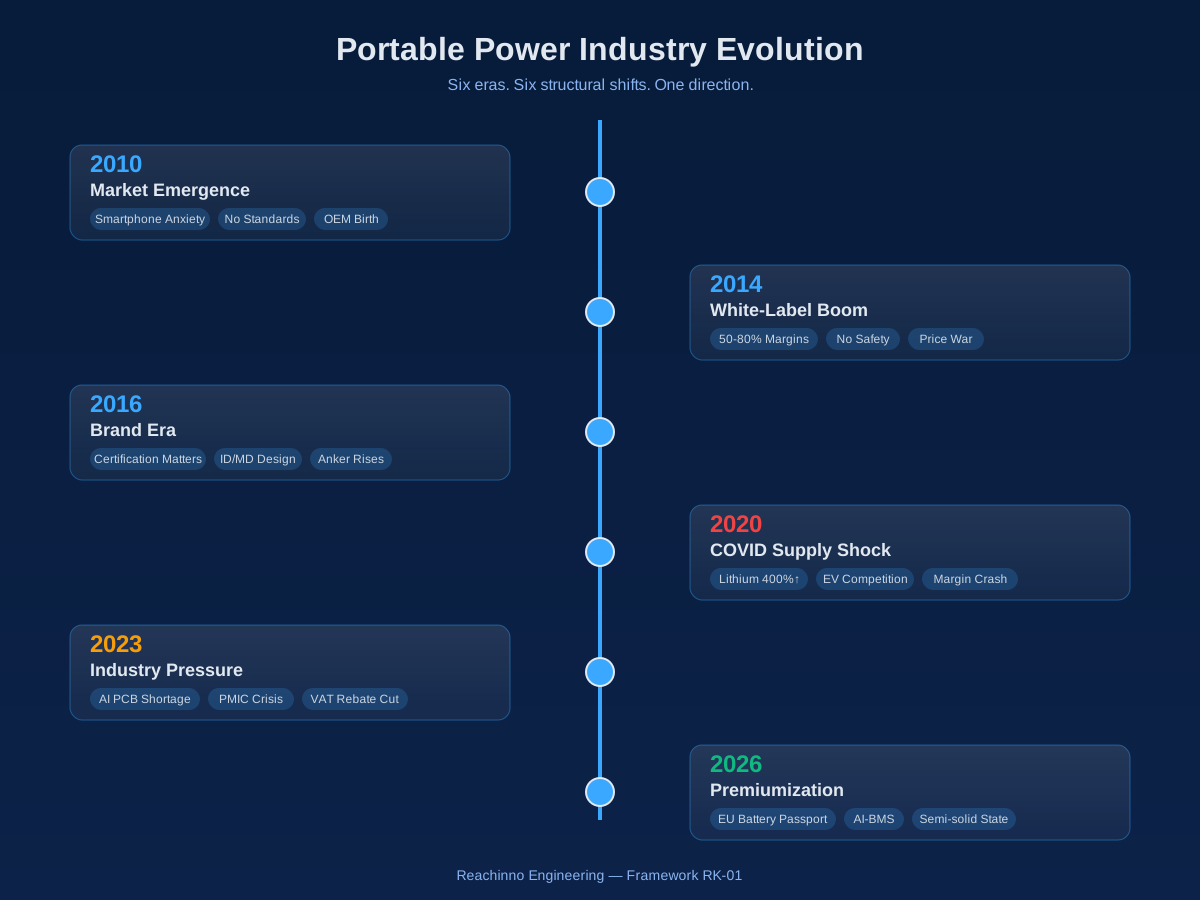
Portable Power Industry Evolution Model - Hero Diagram
Figure 1: The Five-Stage Portable Power Industry Evolution Model — Stage transitions, winning variables, buyer archetypes, and competitive logic at each stage.

Key Takeaways

  • The industry is not a spectrum. It is a sequence of five discrete competitive environments. Each has its own winning variable, buyer archetype, and death trap.
  • Your current strategy is stage-specific. If your evaluation criteria (mAh/dollar) belong to Stage 2 but your market demands Stage 4 (reliability + compliance), you have a structural competitive disadvantage.
  • Stage transitions require structural change, not incremental improvement. Switching suppliers without changing your evaluation methodology simply reproduces the same mismatch with a different factory.

The Five-Stage Model

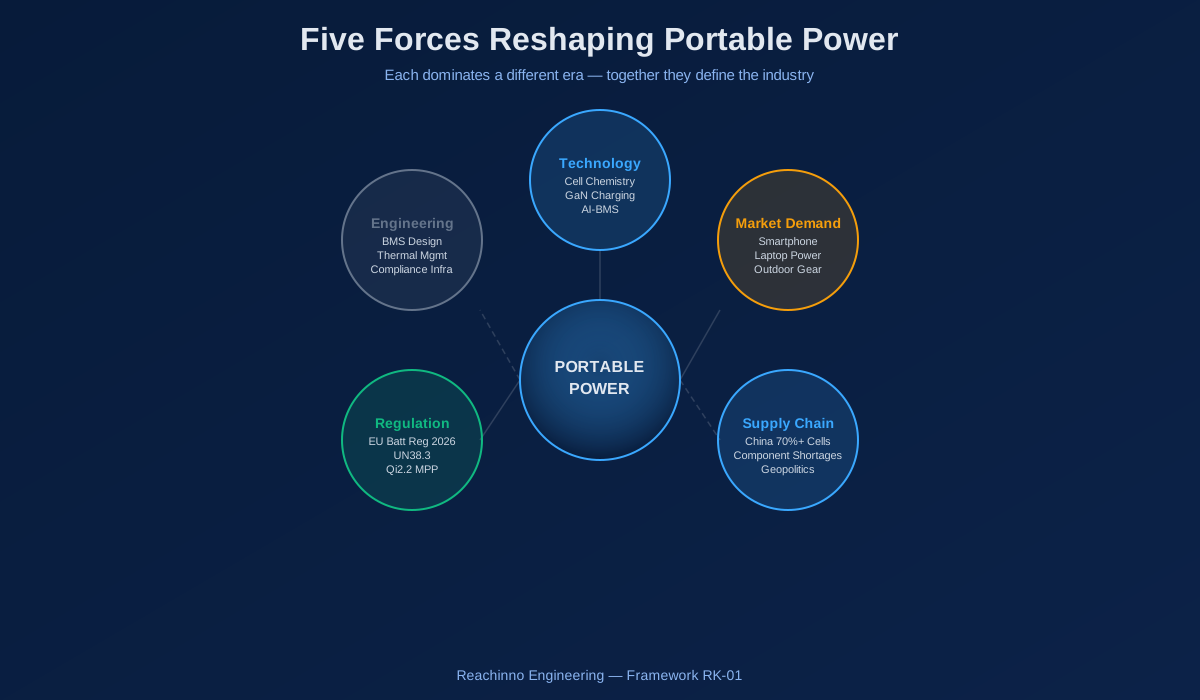
Between 2005 and 2030, the portable power industry progresses through five stages. Each stage is defined not by calendar year but by its competitive logic — the variable that determines who wins.

Portable Power Industry Timeline - Five Stages 2005-2030
Figure 2: Industry timeline from 2005 to 2030+, showing the five stages, key inflection points, and the competitive logic shift at each transition.
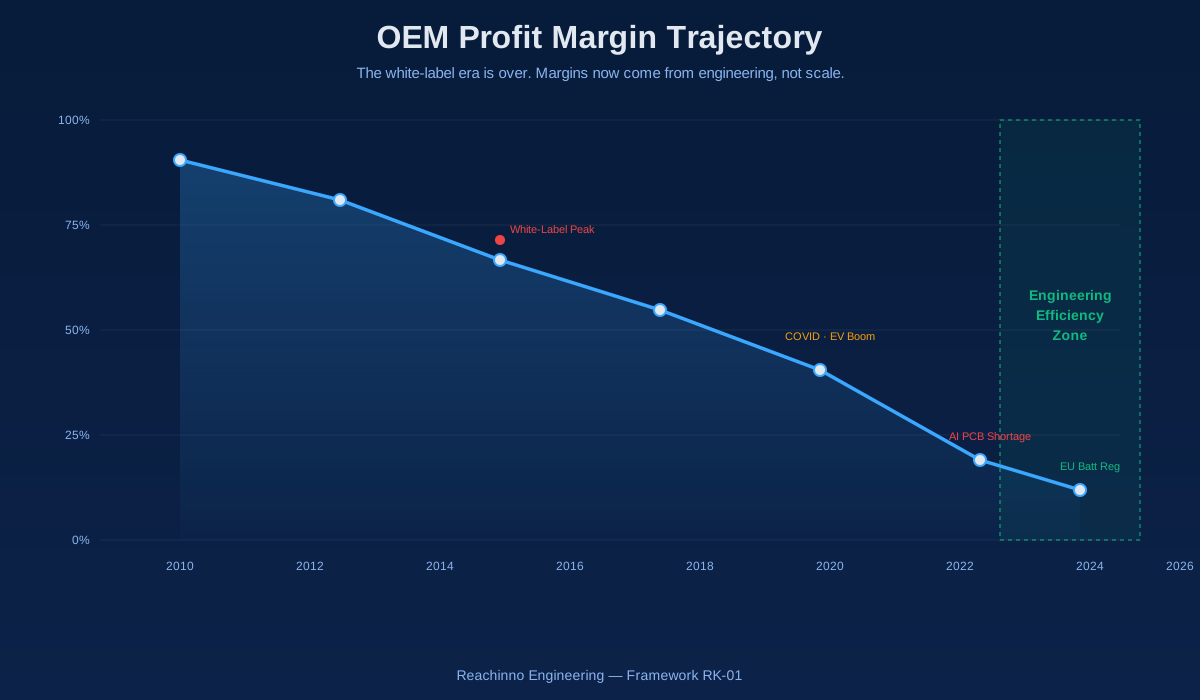
StageEraWinning VariableRepresentative ProductSupplier TypeMargin
S12005-2015Unit price10,000mAh 5V1AShenzhen SME factory5-15%
S22015-2020Spec density20,000mAh 65W PDTop 20 OEM15-25%
S32020-2024Feature uniquenessMagSafe 15W + displayODM with ID/MD25-40%
S42024-2027Reliability + compliance140W PD 3.1 + GaNTier-2 with R&D35-50%
S52027-2030+Technology moatSemi-solid + AI BMSStrategic partner45-60%

Engineering Notes

The following observations come from Reachinno engineering teams working on real OEM projects. These are not theoretical — they are the patterns we see repeatedly across 200+ product development cycles.

Engineering Notes - Real OEM project observations
Figure 3: Engineering observations from 200+ OEM product development cycles. USB-C migration, PD 3.1 thermal design, EU Battery Regulation 2026, BMS intelligence, certification pathways, and supplier-stage mismatch.

These engineering observations are the bridge between industry theory and product reality. A Stage 4 product (premium, compliance-heavy) sourced from a Stage 2 supplier (spec-driven, minimal QMS) will fail — not because the supplier is bad, but because their factory, team, and processes are optimized for a different competitive logic. This is the single most expensive mistake in portable power sourcing.

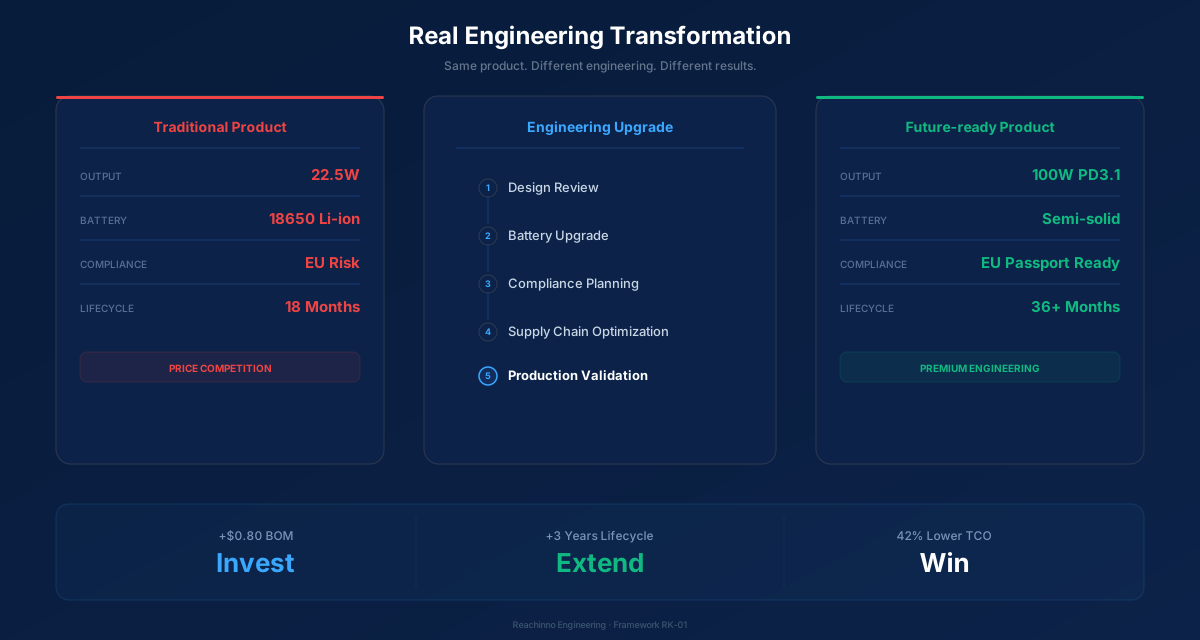
Real Project

A European outdoor brand planned to launch a 22.5W USB-A power bank in 2024. After evaluating the EU Common Charger Directive, the shift to USB-C PD, and the target customer’s device ecosystem, we recommended redesigning the platform to USB-C PD 20W. BOM cost increased by $0.80/unit. Product lifecycle increased by an estimated three years. The brand avoided launching a product that would have been obsolete within 12 months. This is the difference between designing for today’s spec sheet and designing for the industry’s direction.

Decision Guide

Stage Diagnostic

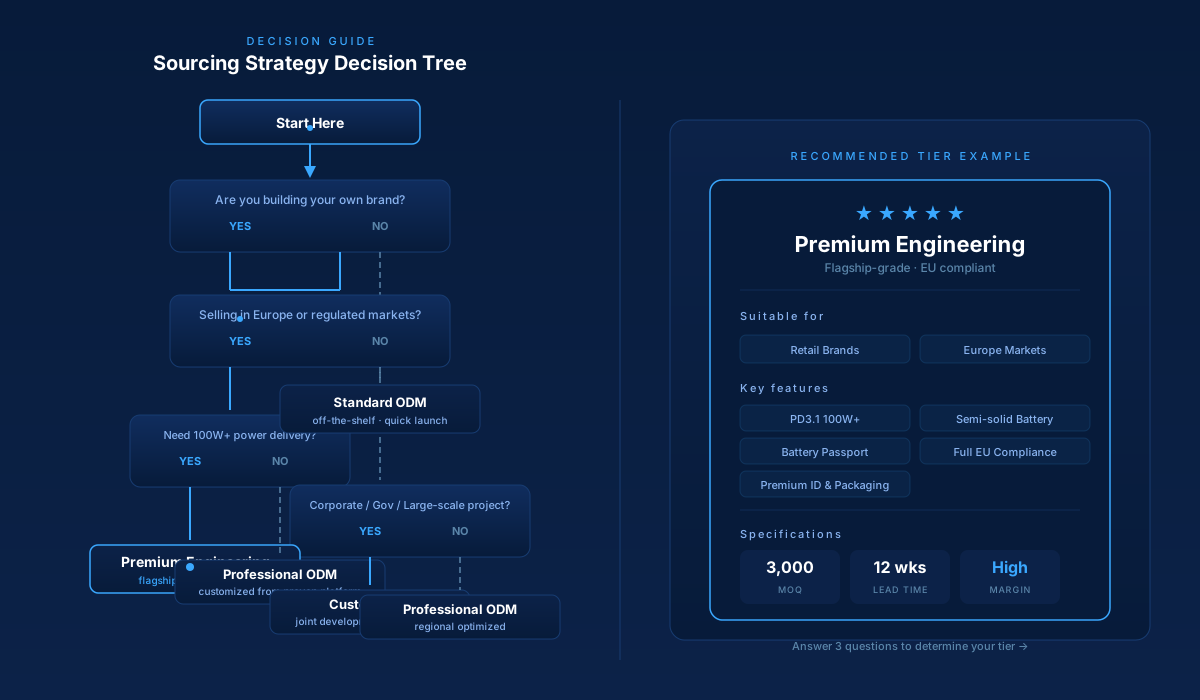
Use this decision flow to diagnose your current industry position. Answer three questions about your competitive reality — not your aspiration — and the framework maps you to your actual stage.

Stage Diagnostic Decision Flow
Figure 4: Three-question stage diagnostic. Your competition basis, certification requirement, and supplier relationship type map you to one of five stages. The gap between your current stage and your target market stage is your structural competitive disadvantage.

Stage Comparison

Each stage operates on fundamentally different rules. The comparison matrix below maps the critical decision dimensions across all five stages — verify that your sourcing strategy matches your target market stage.

Five-Stage Comparison Matrix
Figure 5: Ten-dimensional comparison across all five industry stages. The winning variable, supplier type, certification requirement, margin range, and death trap shift fundamentally at each transition.

FAQ

Q: Can I skip a stage?
Rarely. Stage 3 builds design/compliance muscle Stage 4 requires. Skipping S2→S4 produces premium features with commodity reliability — worst combination.

Q: How fast is the industry moving?
Accelerating. S1: ~10 years. S2: ~5 years. S3: ~4 years. S4: ~3 years projected. EU Battery Regulation 2026 compresses the window further.

Q: What if my supplier cannot support my target stage?
You need a different supplier. No negotiation transforms a Stage 2 factory into a Stage 4 engineering partner.

Framework Version

FrameworkRK-01
Version3.0
PublishedJuly 2026
UpdatedJuly 2026
ContributorsReachinno Engineering Team
Engineer ReviewCharleen Li

Related Frameworks

Apply This Framework

Talk to our engineering team about your stage assessment.

Inquiry Form

Reachinno is your OEM/ODM partner for power solution

and we pay close attention to your requirements.

*Required

Reachinno aim to be the world leading supplier of the power bank.

Subscribe to our newsletter for the latest news and product updates straight to your inbox