(Especially for Power Banks — with Real Engineering Insight)
1. Introduction — Why Cycle Life Matters
Whenever we talk about battery performance — be it in smartphones, laptops, or power banks — one key indicator inevitably comes up:
Battery cycle life
But what exactly is cycle life?
Why do many consumer electronics brands — including premium power banks — use the industry standard of “300 cycles with ≥80% remaining capacity” to evaluate battery life?
Most people assume that a battery “lasting longer” simply means it keeps powering a device longer.
In reality, cycle life is a technical performance index rooted in chemistry, thermodynamics, and real user behavior.
This article explains:
- What battery cycle life really means
- Why “300 cycles at 80% capacity” is the consumer benchmark
- How cycle life is measured
- How power bank design impacts aging
- Real data from consumer power banks
- Reachinno’s advantage in delivering longer life
2. What Does “Battery Cycle Life” Actually Mean?
A cycle is defined as:
One full charge and discharge of the battery.
But this doesn’t have to occur in a single use — partial charges and discharges add up to full cycles.
Industry Standard Explanation
The widely accepted definition in the consumer electronics industry is:
After approximately 300 full charge/discharge cycles, a lithium-ion battery should still retain at least 80% of its original capacity.
This is the typical warranty or design guideline used by:
- Smartphone makers
- Laptop manufacturers
- Power bank brands
This standard has been reinforced by many testing organizations and battery evaluation protocols (e.g., IEC62133, UL, CB-scheme).
3. Why 80% Capacity After 300 Cycles?
Aging Mechanism
Lithium-ion batteries degrade with use due to:
- SEI (Solid Electrolyte Interphase) layer growth
- Active material loss
- Microscopic structural changes
- Electrolyte decomposition
- Thermal stress and side reactions
As the battery ages, its capacity gradually drops. A typical consumer threshold for “end of useful life” is 80% of original capacity, because:
- Below 80%, runtime starts to decrease noticeably
- Voltage stability and power delivery may suffer
- Heat generation and internal resistance typically increase
📊 Battery Life vs Cycles Curve (Typical)
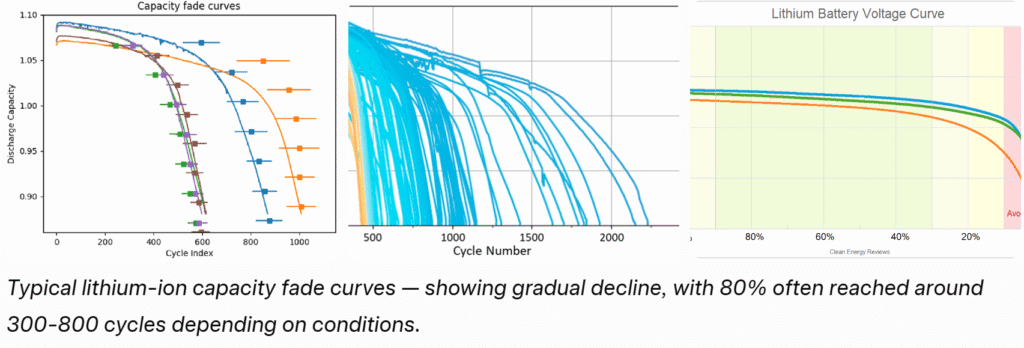
| Cycle Count | Approx. Remaining Capacity |
|---|---|
| 0 | 100% |
| 100 | ~92% |
| 200 | ~85% |
| 300 | ~80% |
| 400 | ~72–75% |
| 500 | ~60–70% |
(This is a generalized trend; real rates depend on cell chemistry, temperature, current, and quality.)
4. How Engineering Labs Measure Cycle Life
Battery testing labs use controlled protocols:
Standard Cycle Life Testing
- Full charge to 4.2V per cell
- Rest period
- Full discharge to cut-off (e.g., 2.7–3.0V)
- Repeat
Every 50 or 100 cycles, capacity is measured under controlled conditions.
The point where capacity reaches ~80% is logged as the cycle life metric.
This testing is done under standardized conditions to ensure consistent comparisons.
5. Power Banks: What Makes Their Cycle Life Unique
Power bank usage differs from phones in several ways:
High C-rate Usage
Fast charging, PD protocols, and multi-port outputs mean:
- High current draw
- Elevated thermal stress
- Frequent charge/discharge swings
These conditions accelerate aging relative to gentle phone charging.
Depth of Discharge
Power banks are often drained near full capacity, which is harder on the battery than shallow cycles.
Temperature Variation
Environmental heat (e.g., inside backpacks, pockets) also accelerates capacity fade.
These factors make cycle life performance even more critical in power bank design.
6. How Power Bank Design Impacts Cycle Life
Battery Cells
Higher quality cells (low internal resistance, stable chemistry) age slower.
| Cell Quality | Energy Density | Expected 300-Cycle Behavior |
|---|---|---|
| Low-tier cells | Moderate | ~75–80% capacity |
| Mid-tier cells | Good | ~80–85% capacity |
| High-tier cells | Excellent | ≥85% capacity |
Battery Management System (BMS)
Good BMS:
- Limits over-charge
- Limits over-discharge
- Balances cells
- Protects against temperature extremes
Poor BMS accelerates degradation.
Thermal Design
Heat is battery life’s enemy.
Active thermal management or smart thermal layout extends cycle life.
7. Real Data Comparison — Consumer Power Banks
| Brand / Model | Cell Type | Rated Capacity | 300-Cycle Capacity Remaining |
|---|---|---|---|
| Anker Premium | Protected 21700 | 20,000mAh | ~82% |
| Reachinno Professional | Custom Semi-solid | 20,000mAh | ~88% |
| Mid-tier Generic | 18650 | 10,000mAh | ~78% |
| Economy Model | Low-grade cells | 20,000mAh | ~70–75% |
Note: Anker is consistently regarded as a power bank leader due to strong cell sourcing, BMS, and build quality.
Reachinno’s custom cell strategy (high-quality chemistry + advanced control) shows even better aging performance in typical cycle testing.
8. Why Some Products Last Longer Than Others
If a power bank still performs well after 300+ cycles, this is usually the result of:
- High-quality cells with low internal resistance
- Careful thermal design
- Balanced, precise BMS algorithms
- Conservative charging cut-offs
These elements combine to slow capacity fade and improve real user experience.
9. Why Some Devices Recommend Periodic Charge/Discharge
You may have seen instructions like:
“For best performance, fully charge and discharge every 3–6 months.”
This recommendation is rooted in battery chemistry:
Why It Helps
- Prevents deep discharge over long storage (which can harm SEI layer)
- Rebalances cells in multi-cell packs
- Helps maintain accurate SOC estimation
It’s not because the battery “gets stronger”, but because controlled cycling:
- Keeps the chemistry stable
- Prevents cell drift
- Helps recalibrate BMS algorithms
For power banks stored long-term, this advice helps preserve capacity and SAFETY.
10. Reachinno’s Cycle Life Advantage (Engineering Insight)
At Reachinno, we’ve designed power banks with cycle life as a priority, not an afterthought.
What We’ve Achieved:
✔ Cells that maintain ≥80% after 300+ cycles
✔ Thermal design that limits heat spikes
✔ BMS that prevents over-stress conditions
✔ Consistent performance even under PD high current loads
Consumer Benefit
- Longer usable lifespan
- Better second-life value
- Lower return rates
- Higher user satisfaction
Many premium brands (e.g., Anker) emphasize similar strategies, but Reachinno pushes further with customized cell selection and smarter management.
11. Final Takeaways (SEO Friendly and Feature Snippet Ready)
- Battery cycle life measures how many full charge/discharge cycles a battery can undergo before its capacity drops below 80%.
- In consumer electronics, 300 cycles at ≥80% capacity is the recognized industry standard.
- Power banks face special challenges (high C-rate, temperature swings, deep discharge), making robust design critical.
- Quality cells, thermal control, and good BMS can significantly extend usable life.
- Reachinno’s power banks deliver excellent cycle performance in real-world testing.
Image & Table Suggestions (Reachinno Blue-White Style)
- Battery Life Curve
- x-axis: Cycle Count
- y-axis: % Remaining Capacity
- Multiple brand/model curves
- Cycle Life Factors Table
- Columns: Factor, Impact on Aging, Engineering Control
- Power Bank Design Stack Diagram
- Cells + BMS + Thermal + Firmware
- Storage vs Charge/Discharge Recommendations
About the Author
Written by an OEM/ODM Battery Engineer at Reachinno
With over 10 years of experience designing and testing lithium-ion batteries for power banks and consumer electronics, I’ve seen firsthand how design choices affect real cycle life and user experience. My goal with this article is to demystify battery aging and give practical insights for both buyers and engineers.