Framework RK-01 · Industry & Strategy · v4.0
Portable Power Industry Evolution Model
A seven-era decision framework for OEM buyers and product managers to understand how technology, supply chains, regulations, and market demand have reshaped portable power — and what comes next.
Why This Framework Matters
Understanding how the portable power industry has evolved helps OEM buyers, product managers, and engineers make better decisions about future products. Rather than viewing industry changes as isolated events, this framework explains how technology, supply chains, regulations, and market demand have continuously reshaped product development priorities.
Knowledge for Better Decisions
In One Minute
The portable power industry has progressed through seven distinct eras — from market emergence around 2008 to today’s multi-layer cost pressure environment. Each era has its own dominant evolution driver, competitive logic, and engineering reality. A strategy optimized for one era fails in the next — not because it is a bad strategy, but because the industry structure has changed.
Key Takeaways
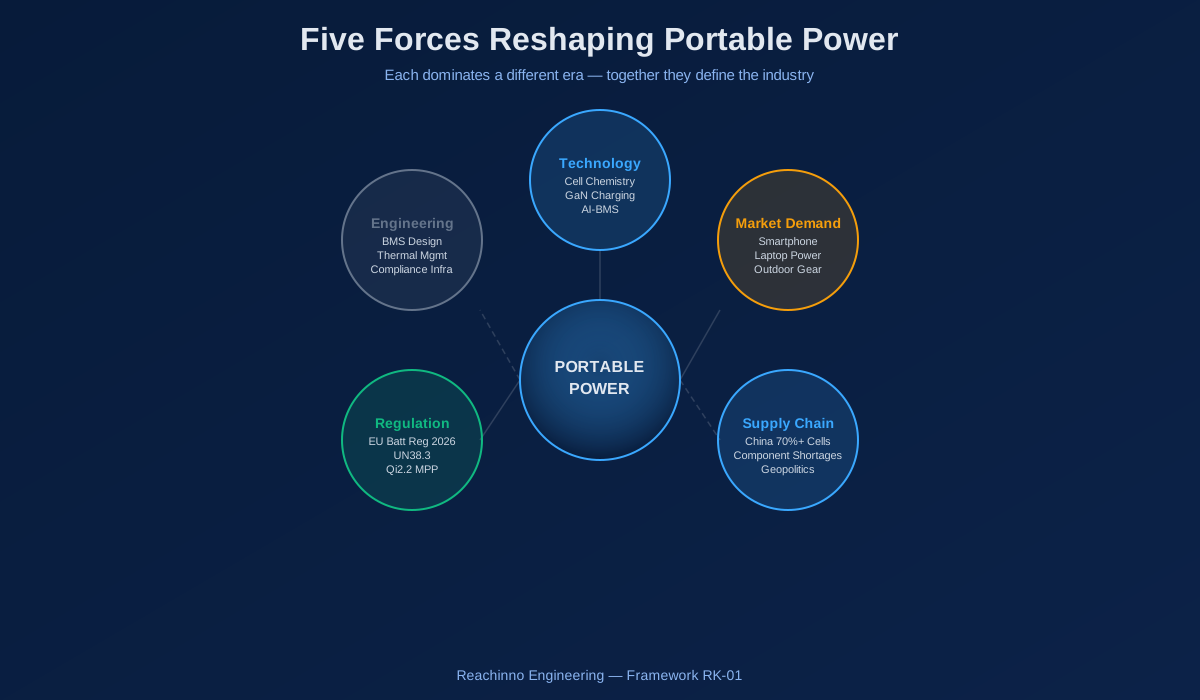
- The industry evolved through 7 eras, not 5 stages. Each era is driven by a different dominant force — technology, supply chain, regulation, market demand, or engineering capability.
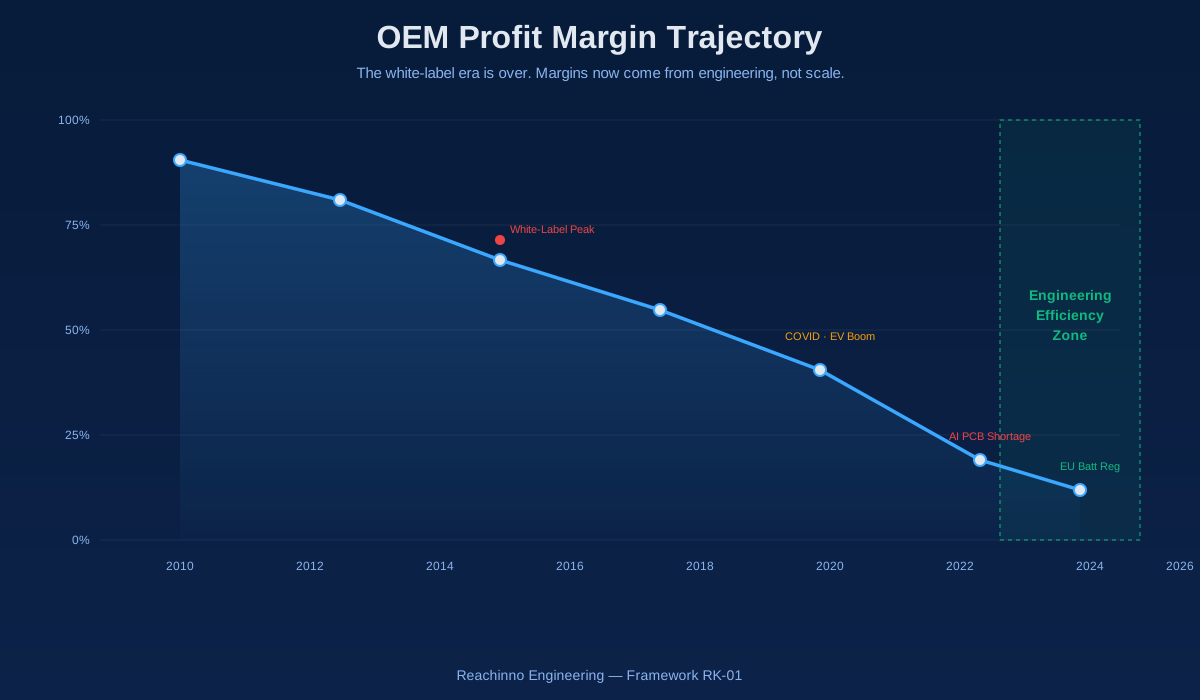
- White-label era margins (50-80%) no longer exist. Today’s OEM profitability depends on engineering efficiency, not manufacturing scale.
- Chinese cell manufacturers now supply 70%+ of global portable power cells. Supply chain leverage has fundamentally shifted from Japan/Korea to China.
- Multi-layer cost pressure (AI servers → PCB → IC shortage + tax policy + geopolitics) is structural, not cyclical. This is the new baseline.
- The dominant evolution driver shifts every 2-4 years. Companies optimized for the previous era’s driver lose competitiveness in the next.
The Seven Eras
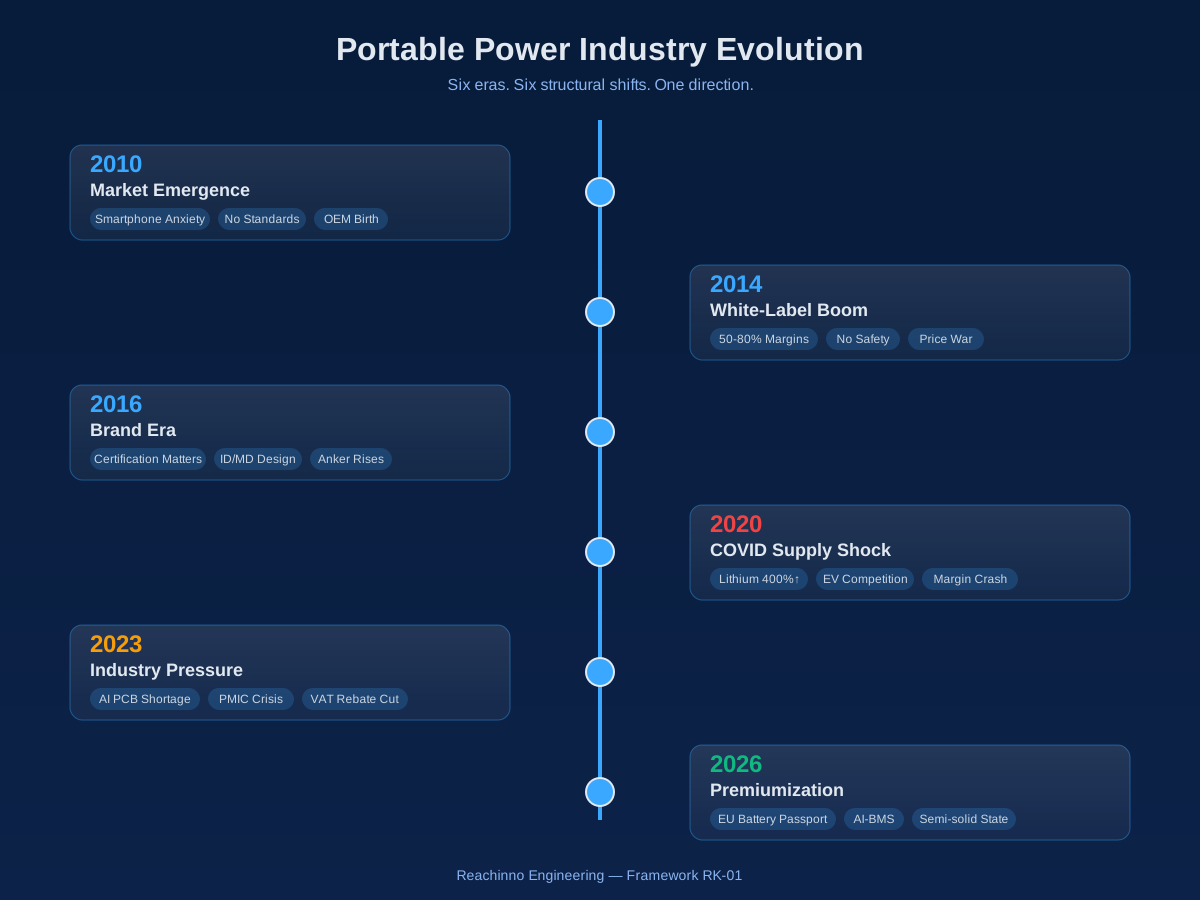
From market emergence around 2008 to the intelligence era of 2030+, the portable power industry has been reshaped by five fundamental drivers: Technology, Supply Chain, Regulation, Market Demand, and Engineering Capability. The matrix below maps each driver’s relative strength across all seven eras.
| Era | Timeframe | Dominant Driver | Key Characteristics | Engineering Impact | Representative Products |
|---|---|---|---|---|---|
| 0. Foundation | 1991 | Technology Breakthrough | Sony commercialized lithium-ion battery — made modern rechargeable portable electronics possible | Li-ion cell technology established | — |
| 1. Market Emergence | ~2008-2010 | Market Demand | Smartphone adoption, USB standardization, portable power demand | Basic 5V/1A charging, 18650 cells | 5,000mAh power banks |
| 2. White-Label Expansion | 2010-2014 | Supply Chain | Explosive demand, low barriers, inconsistent quality, no safety standards | Generic molds, minimal protection, price-driven sourcing | Unbranded 10,000mAh |
| 3. Supply Chain Transformation | 2013-2016 | Supply Chain | Japanese/Korean→Chinese cells, cost optimization, mass production | 18650 cost ↓60%, accessible BOM | Affordable branded power banks |
| 4. Brand-Driven Competition | 2015-2019 | Market Demand | Certification, quality, ID, UX, safety as differentiators | Multi-protocol charging, improved ID/MD | Anker PowerCore, Xiaomi Mi |
| 5. Performance + Compliance | 2019-2023 | Technology + Regulation | USB-C PD, GaN, Qi, UN38.3/MSDS baseline, COVID disruptions | 65W-100W output, GaN integration | 65W GaN charger + power bank |
| 6. Industry Pressure Era | 2023-2026 | Multi-Layer Cost Pressure | AI servers→PCB→IC shortage, tax rebate adjustment, geopolitics, supply chain diversification | Engineering efficiency > manufacturing scale | 140W PD 3.1 products |
| 7. Premiumization + Intelligence | 2026-2030+ | Regulation + Technology | EU Battery Reg 2026, Battery Passport, AI BMS, semi-solid state, software-defined power | Compliance infrastructure, AI-driven BMS | Semi-solid + AI BMS products |
COVID-19 Impact (2020-2022): Manufacturing shutdowns, logistics disruptions, and raw material shortages. EV demand accelerated, energy storage demand accelerated, and lithium prices surged ~400%. Consumer electronics manufacturers experienced severe cost pressure due to competition for battery cells with the automotive industry.
Industry Profit Evolution
The profitability of portable power manufacturing has shifted dramatically across eras. The chart below traces margin trajectory from the market’s birth in 2008 to today’s multi-pressure environment.
OEM profitability has shifted from manufacturing scale to engineering efficiency. The white-label era’s 50-80% margins are gone. Today’s 10-20% margins require lean engineering, compliance infrastructure, and supply chain integration to remain viable.
How to Read This Framework
Each era in this framework follows a consistent structure: Era name and timeframe → Key characteristics → Engineering impact → Business impact → Representative products. This structure ensures every era is analyzed at the level that matters for product and sourcing decisions — not just market commentary.
Engineering Notes
The following observations come from Reachinno engineering teams working on real OEM projects across multiple eras. These are not theoretical — they are patterns observed across 200+ product development cycles.
These engineering observations bridge industry theory and product reality. The most expensive mistake in portable power sourcing is applying one era’s evaluation criteria to another era’s supplier landscape.
Real Project
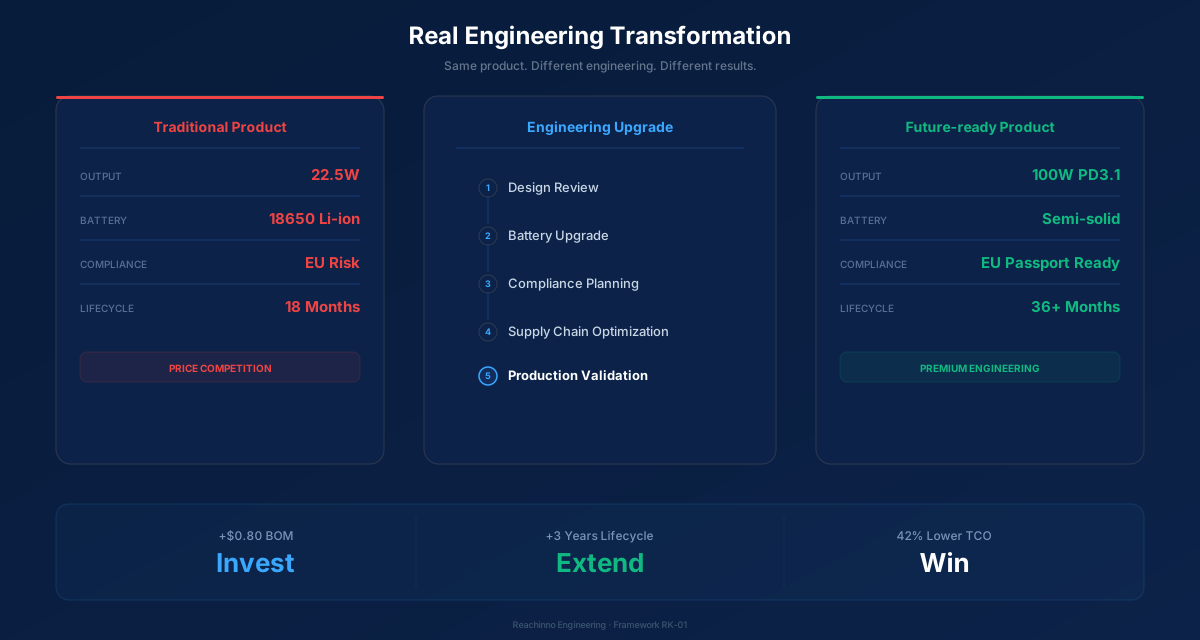
A European outdoor brand planned to launch a 22.5W USB-A power bank in 2024. After evaluating the EU Common Charger Directive, the shift to USB-C PD, and the target customer’s device ecosystem, we recommended redesigning the platform to USB-C PD 20W. BOM cost increased by $0.80/unit. Product lifecycle increased by an estimated three years. The brand avoided launching a product that would have been obsolete within 12 months. This is the difference between designing for today’s spec sheet and designing for the industry’s direction.
Decision Guide
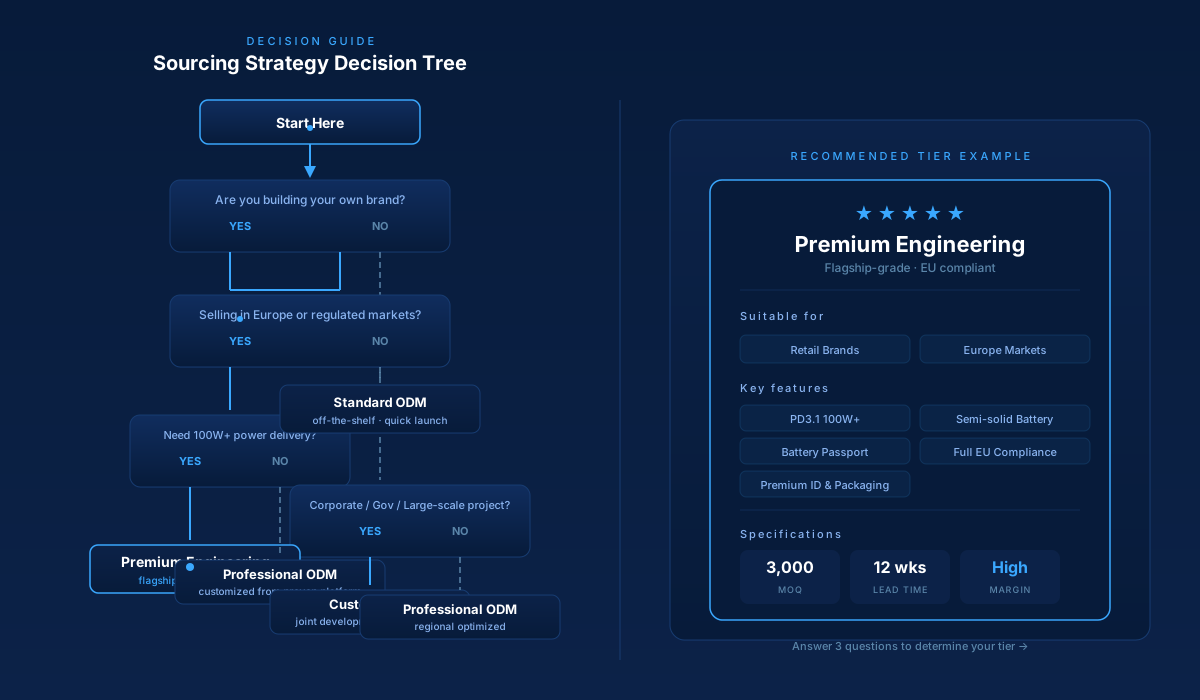
Use this decision flow to diagnose which era your current sourcing strategy is optimized for — and whether that matches your target market’s era.
FAQ
Can I skip an era?
Rarely successful. Each era builds infrastructure (supply chain relationships, certification capability, design maturity) the next era requires.
How fast is the industry moving?
Accelerating. Era 2 lasted ~4 years. Era 5 lasted ~4 years. Era 6 is projected at ~3 years. EU Battery Regulation 2026 is a hard deadline.
What if my supplier cannot support my target era?
You need a different supplier. No negotiation transforms an Era 3 factory into an Era 7 engineering partner.
Framework Version
| Field | Value |
|---|---|
| Framework | RK-01 |
| Version | 4.0 |
| Published | July 2026 |
| Updated | July 2026 |
| Contributors | Reachinno Engineering Team |
| Engineer Review | Charleen Li |
Related Frameworks
- RK-02 Battery Cell Selection Framework
- RK-03 OEM Development Stage-Gate Framework
- RK-04 Portable Power Decision Matrix
- RK-15 OEM Partner Evaluation Framework