Based on Real Test Data from Smartphone Wireless Charging Systems
If your phone battery is still dropping while using a wireless charger, you’re not alone.
This happens because real wireless charging power is often much lower than advertised. Even a “15W wireless charger” typically delivers only 7–10W in real-world usage due to power loss, heat, and alignment issues.
In this study, we analyze the real wireless charging power curve, efficiency losses, and why wireless charging often fails to keep up with phone power consumption.Wireless charging has become a standard feature in modern smartphones. Systems like MagSafe and the new Qi2 Wireless Charging Standard promise faster and more convenient charging.
However, real-world testing reveals that wireless charging power is far from constant.
Using laboratory test data from devices such as the iPhone 15, we analyzed the actual power curve, efficiency loss, and real charging behavior of wireless charging systems.
This study explains:
- the true wireless charging power curve
- energy efficiency loss
- differences between MagSafe and Qi2
- and a real charging time model
1. Wireless Charging Power Is Dynamic, Not Constant
Most wireless chargers are marketed as:
15W wireless charging
But our measurements show that 15W is only a short peak value.
Actual wireless charging follows a dynamic power curve controlled by the phone’s battery management system.
Typical stages include:
| Stage | Behavior |
|---|---|
| Startup | Power negotiation |
| Ramp-up | Rapid power increase |
| Peak | Maximum output |
| Thermal regulation | Gradual reduction |
| Battery protection | Low trickle charging |
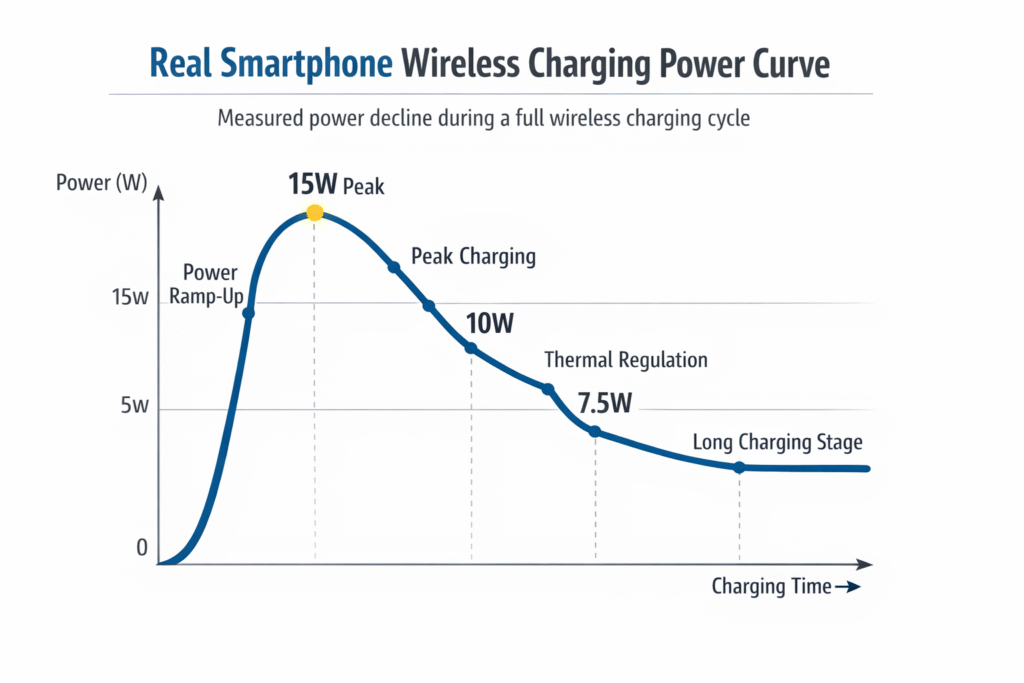
2. Real Test Data: Wireless Charging Power
Our laboratory testing shows the following pattern.
Real Measurement Example
| Time | Power |
|---|---|
| Start | 0.01W |
| 10s | 0.14W |
| Ramp-up | 5W–12W |
| Peak | ~15W |
| Thermal control | 7–10W |
| Long stage | 5–7W |
Key observation:
The 15W peak typically lasts only a few minutes.
The average charging power is significantly lower.
3. Wireless Charging Efficiency Calculation
Another important finding is the difference between transmitter power and battery input power.
Transmitter Output
Example measurement:
Voltage: 8.9V
Current: 2.95A
Power calculation:
P = V × I
P = 8.9 × 2.95
P ≈ 26.2W
However, the actual charging power reaching the battery is only:
≈ 7W – 10W
Efficiency Formula
Wireless charging efficiency:
Efficiency = Battery Power / Transmitter Power
Example:
Efficiency = 9W / 26W
Efficiency ≈ 35%
Typical Efficiency Range
| Charging Method | Efficiency |
|---|---|
| Wired charging | 90–95% |
| Magnetic wireless charging | 70–80% |
| Standard wireless charging | 60–70% |
Energy loss mainly occurs in:
- coil coupling loss
- power conversion
- heat generation
- alignment loss
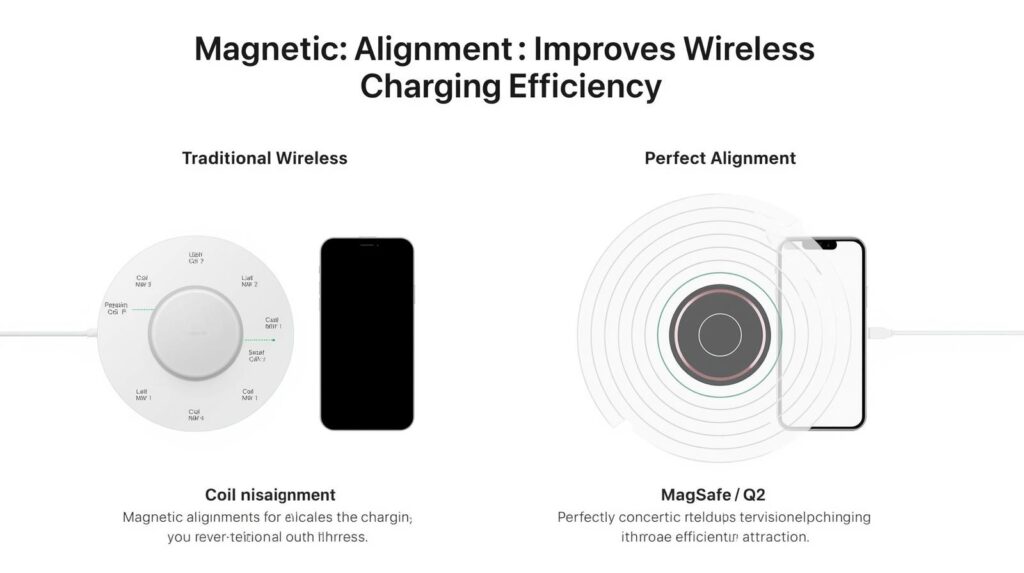
4. MagSafe vs Qi2 Charging Systems
The new Qi2 Wireless Charging Standard was largely inspired by the magnetic alignment system used in MagSafe.
Both systems improve alignment and efficiency compared to traditional wireless charging.
Comparison
| Feature | MagSafe | Qi2 |
|---|---|---|
| Magnetic alignment | Yes | Yes |
| Peak charging power | 15W | 15W |
| Ecosystem | Apple devices | Multi-brand |
| Alignment accuracy | High | High |
| Compatibility | Apple ecosystem | Android + Apple |
Key improvement of Qi2:
Magnetic Power Profile (MPP)
This improves:
- coil alignment
- energy transfer efficiency
- accessory compatibility
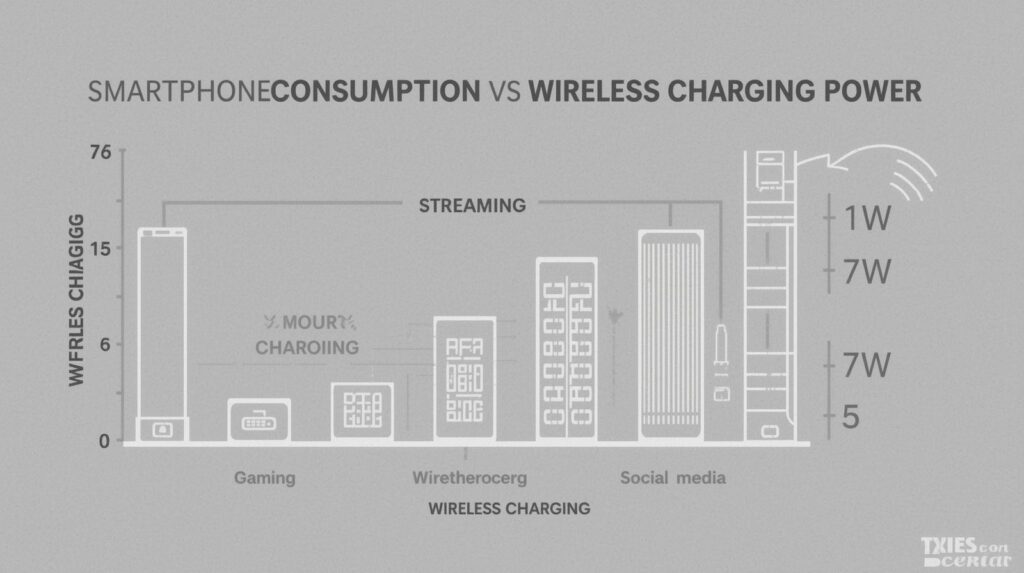
5. Smartphone Power Consumption vs Charging Power
Another reason users see battery percentage drop during wireless charging is phone power consumption.
Typical smartphone usage power:
| Activity | Power |
|---|---|
| Idle | 1–2W |
| Social media | 3–5W |
| Video streaming | 5–7W |
| Gaming | 8–12W |
Example scenario:
Wireless charging = 7W
Phone consumption = 8W
Result:
Battery level still decreases
This explains a common user complaint:
“My phone is charging but the battery percentage still drops.”
6. Real Wireless Charging Time Model
Because wireless charging power decreases over time, charging time is not linear.
Typical charging behavior:
| Battery Level | Charging Power |
|---|---|
| 0–30% | 12–15W |
| 30–60% | 8–12W |
| 60–80% | 6–8W |
| 80–100% | 3–5W |
Simplified Charging Time Model
Charging time estimation:
Charging Time = Battery Capacity / Average Charging Power
Example:
Battery capacity:
5000mAh ≈ 19Wh
Average wireless charging power:
≈ 7W
Estimated time:
19Wh / 7W ≈ 2.7 hours
Real time including thermal regulation:
≈ 3–3.5 hours
7. Why Wireless Charging Power Drops
Wireless charging power reduction is controlled by the phone’s battery management system.
Key factors include:
- battery temperature
- charging stage
- coil alignment
- system safety limits
This ensures:
- battery longevity
- system stability
- thermal safety
Key Findings
From real wireless charging tests we observe:
• Wireless charging peak power lasts only a short time
• Average charging power is usually 5–10W
• System efficiency can drop to 30–40% in real scenarios
• Phone usage can exceed charging input power
• Magnetic alignment systems improve efficiency but do not eliminate losses
FAQ
Q1: Why is my phone losing battery while wireless charging?
Answer:Because wireless charging power is often lower than the phone’s power consumption.
For example:
- Gaming: ~10–12W
- Wireless charging: ~7–9W
If consumption exceeds charging input, battery level will drop.
Q2: What is real wireless charging efficiency?
Real-world wireless charging efficiency from power bank battery to phone battery is typically 55–60%.
Q3: Is Qi2 more efficient than traditional wireless charging?
Yes. Magnetic alignment improves efficiency by ensuring optimal coil positioning.