Test Setup
To understand real wireless charging efficiency, we conducted controlled lab testing.
Test variables included:
- smartphone battery capacity
- wireless power bank output
- alignment conditions
- charging duration
- temperature control
All tests were performed under stable environmental conditions to ensure consistency.
Test Results
| Scenario | Efficiency |
|---|---|
| Perfect alignment | ~60% |
| Normal daily use | ~55% |
| Misalignment | 45–50% |
What These Numbers Actually Mean
Most wireless chargers are marketed based on peak output power.
But users don’t experience peak power —
they experience average efficiency.
And that’s where the gap is.
Energy Loss Breakdown
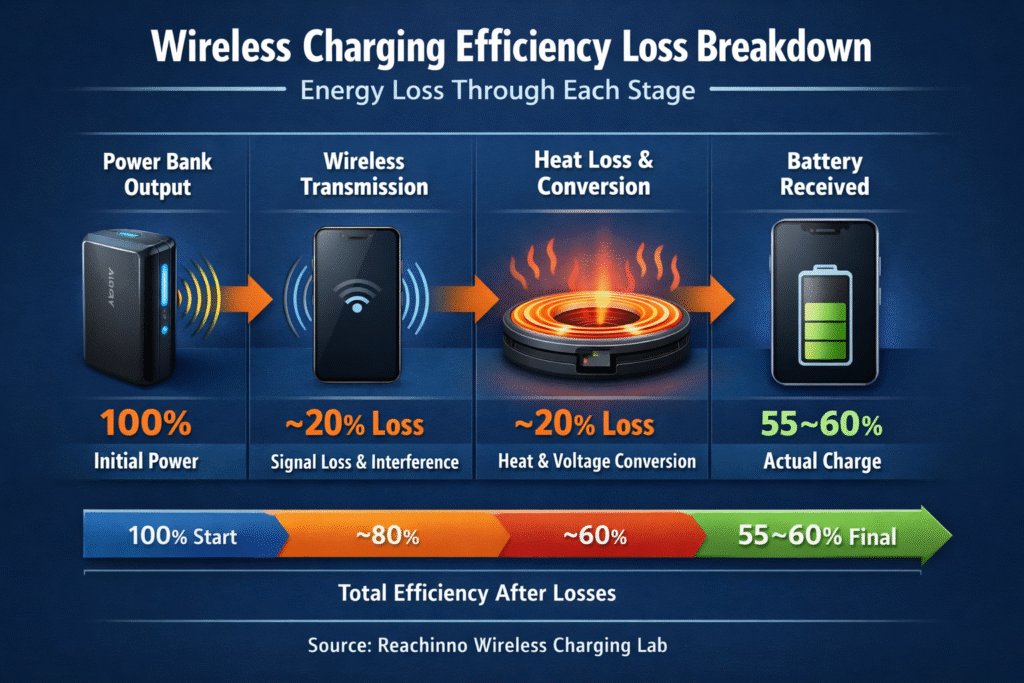
Caption:
Energy loss across the wireless charging transmission chain.
Where the Energy Is Lost
Energy loss mainly occurs in:
- wireless transmission
- heat dissipation
- voltage conversion
- coil inefficiency
Each stage introduces small losses —
combined, they become significant.
Real Charging Performance
Even with a 15W wireless charger:
- sustained power is typically 7–10W
- charging slows as temperature increases
- alignment directly affects performance
Why Efficiency Drops in Daily Use
In real use, efficiency is affected by:
- device movement
- heat buildup
- imperfect alignment
- background power consumption
This is why users often feel:
“It’s charging, but not really charging.”
Key Takeaway
Wireless power banks typically deliver:
55–60% of stored energy to the phone battery
This is normal behavior, not a product issue.
👉 wireless charging power curve
👉 wireless charging efficiency map
👉 real 15W wireless charging speed
Source: Reachinno Wireless Charging Lab